

Search...


Firewall Logs
Introduction
Firewall Logs feature provides a comprehensive visibility into network traffic flowing through your Virtual Datacenter (VDC). This powerful monitoring and analysis tool captures detailed information about connections between your resources, giving you insights into communication patterns, security events, and network performance.
By surfacing Perimeter and Micro-segmentation Next-Generation Firewall (NGFW) logs, they enable administrators, network engineers, and security analysts to understand the complete picture of network communications, troubleshoot connectivity issues, identify potential security threats, and ensure compliance with security policies.
Key Features
- Comprehensive Traffic Visibility: Diagnose firewall traffic, through both perimeter (North-South) and micro-segmentation (East-West) firewalls
- Advanced Filtering: Quickly narrow down traffic by direction, policy type, source/destination, service, and firewall action.
- Detailed Connection Information: View complete details including timestamp, source and destination IPs, sent/received bandwidth usage, firewall action, and more.
- Security Context: Understand the security implications with firewall action details, and policy identification
- Internal Service Monitoring: Track communication between internal services to understand application dependencies and detect unauthorized lateral movement
Common Use Cases
- Application Troubleshooting: Diagnose connectivity issues between services by filtering for specific sources, destinations, or error messages
- Shadow IT Detection: Discover unauthorized services or unexpected external connections using our NGFW
- Performance Monitoring: Identify bandwidth-intensive connections and unusual traffic patterns that may impact performance
- Compliance Verification: Confirm that sensitive systems are properly isolated and access controls are functioning as expected
- Security Incident Investigation: Trace the path of potential security breaches by examining denied connections and high-risk traffic
- Network Architecture Planning: Understand communication flows to inform decisions about segmentation and security boundaries
Getting Started
Accessing Traffic Logs
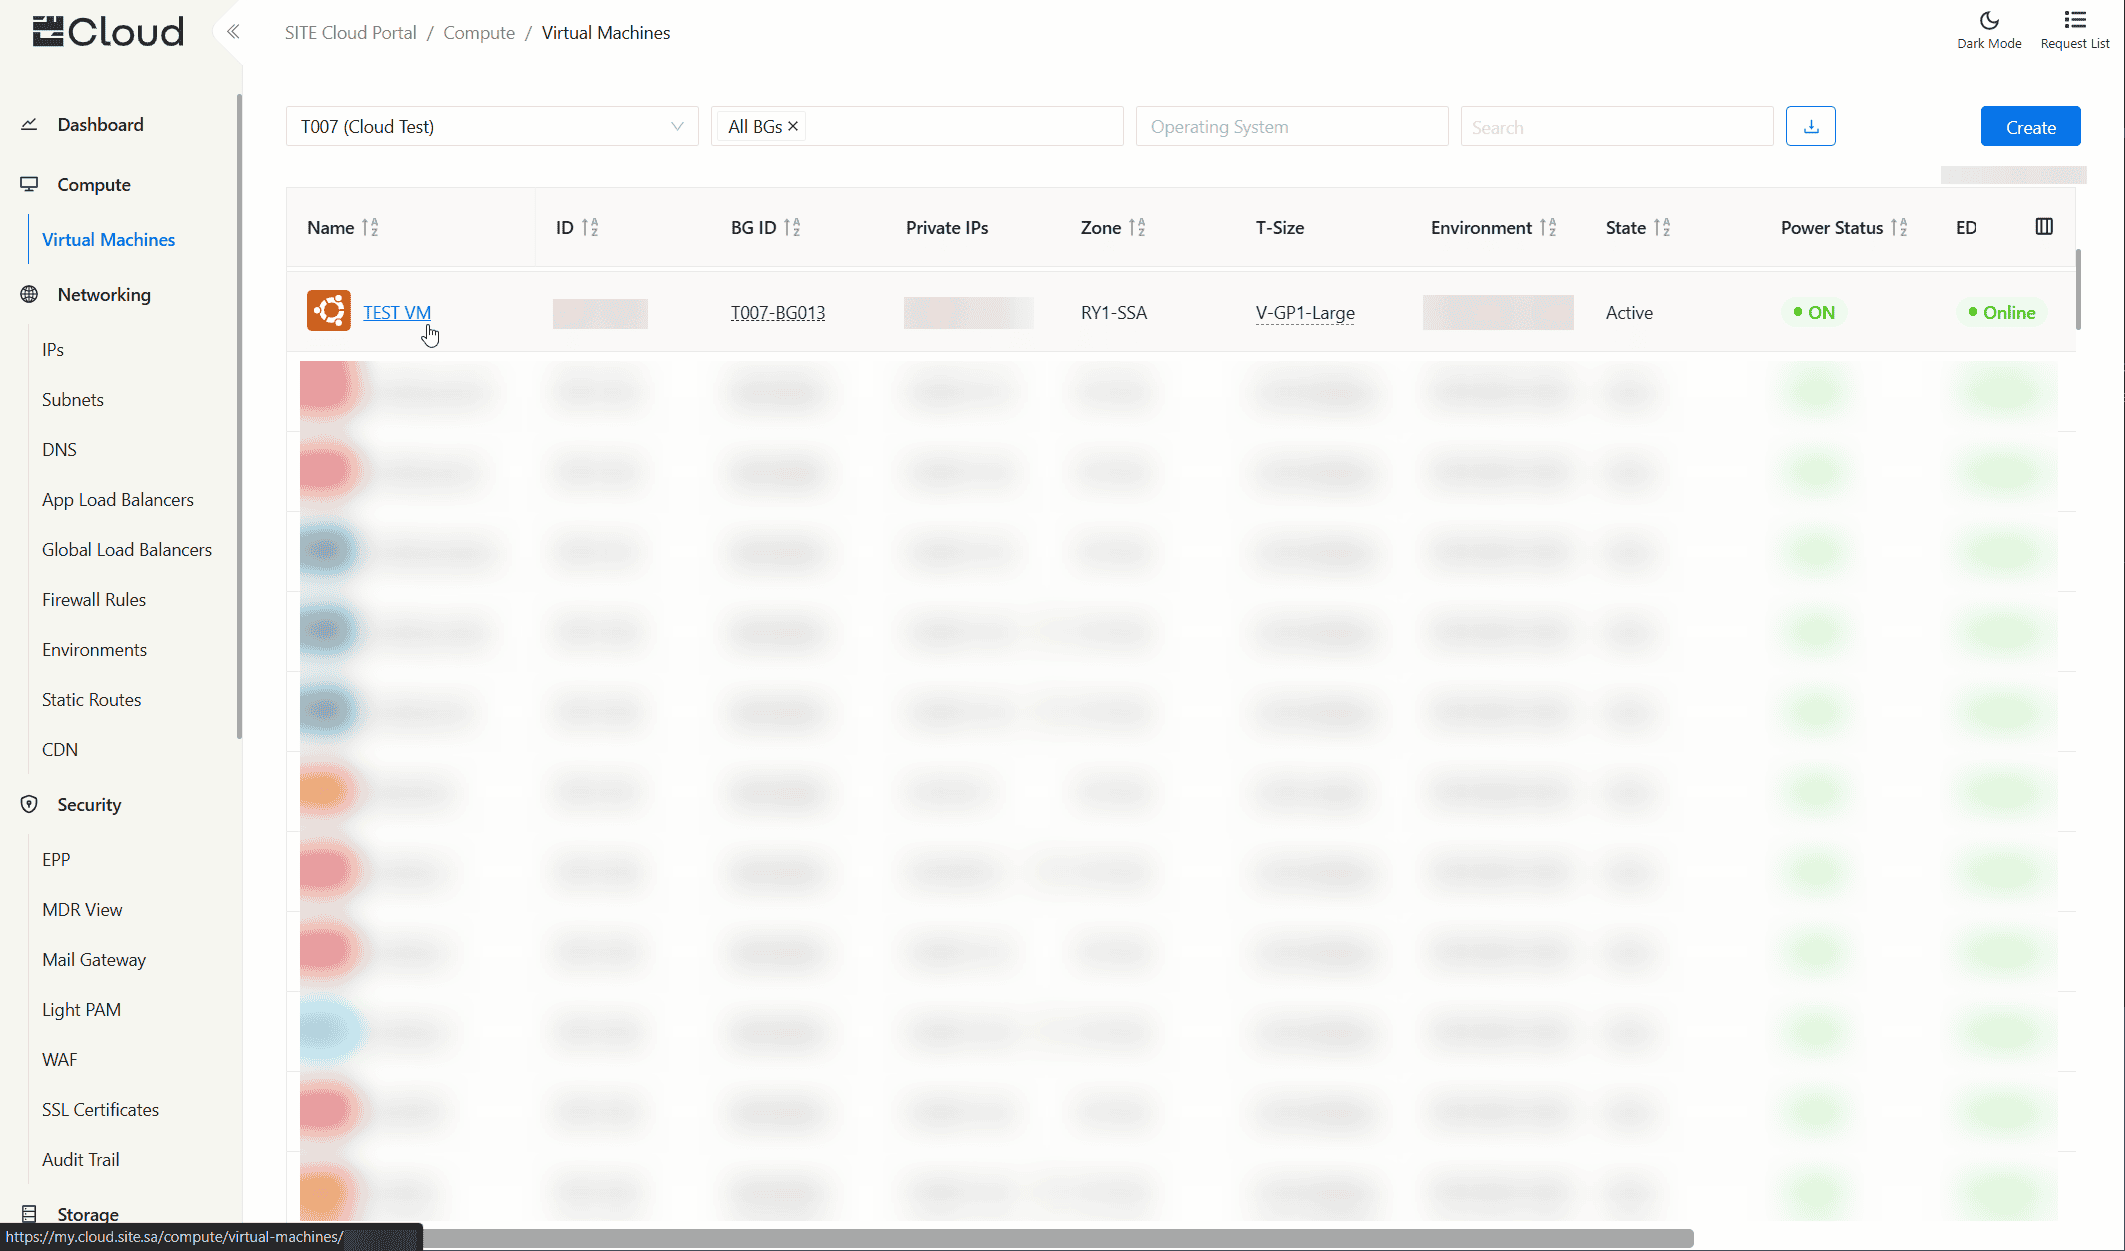
Virtual Machines
- Navigate to the Virtual Machines page using the side navigation menu
- Click on any virtual machine to view its logs
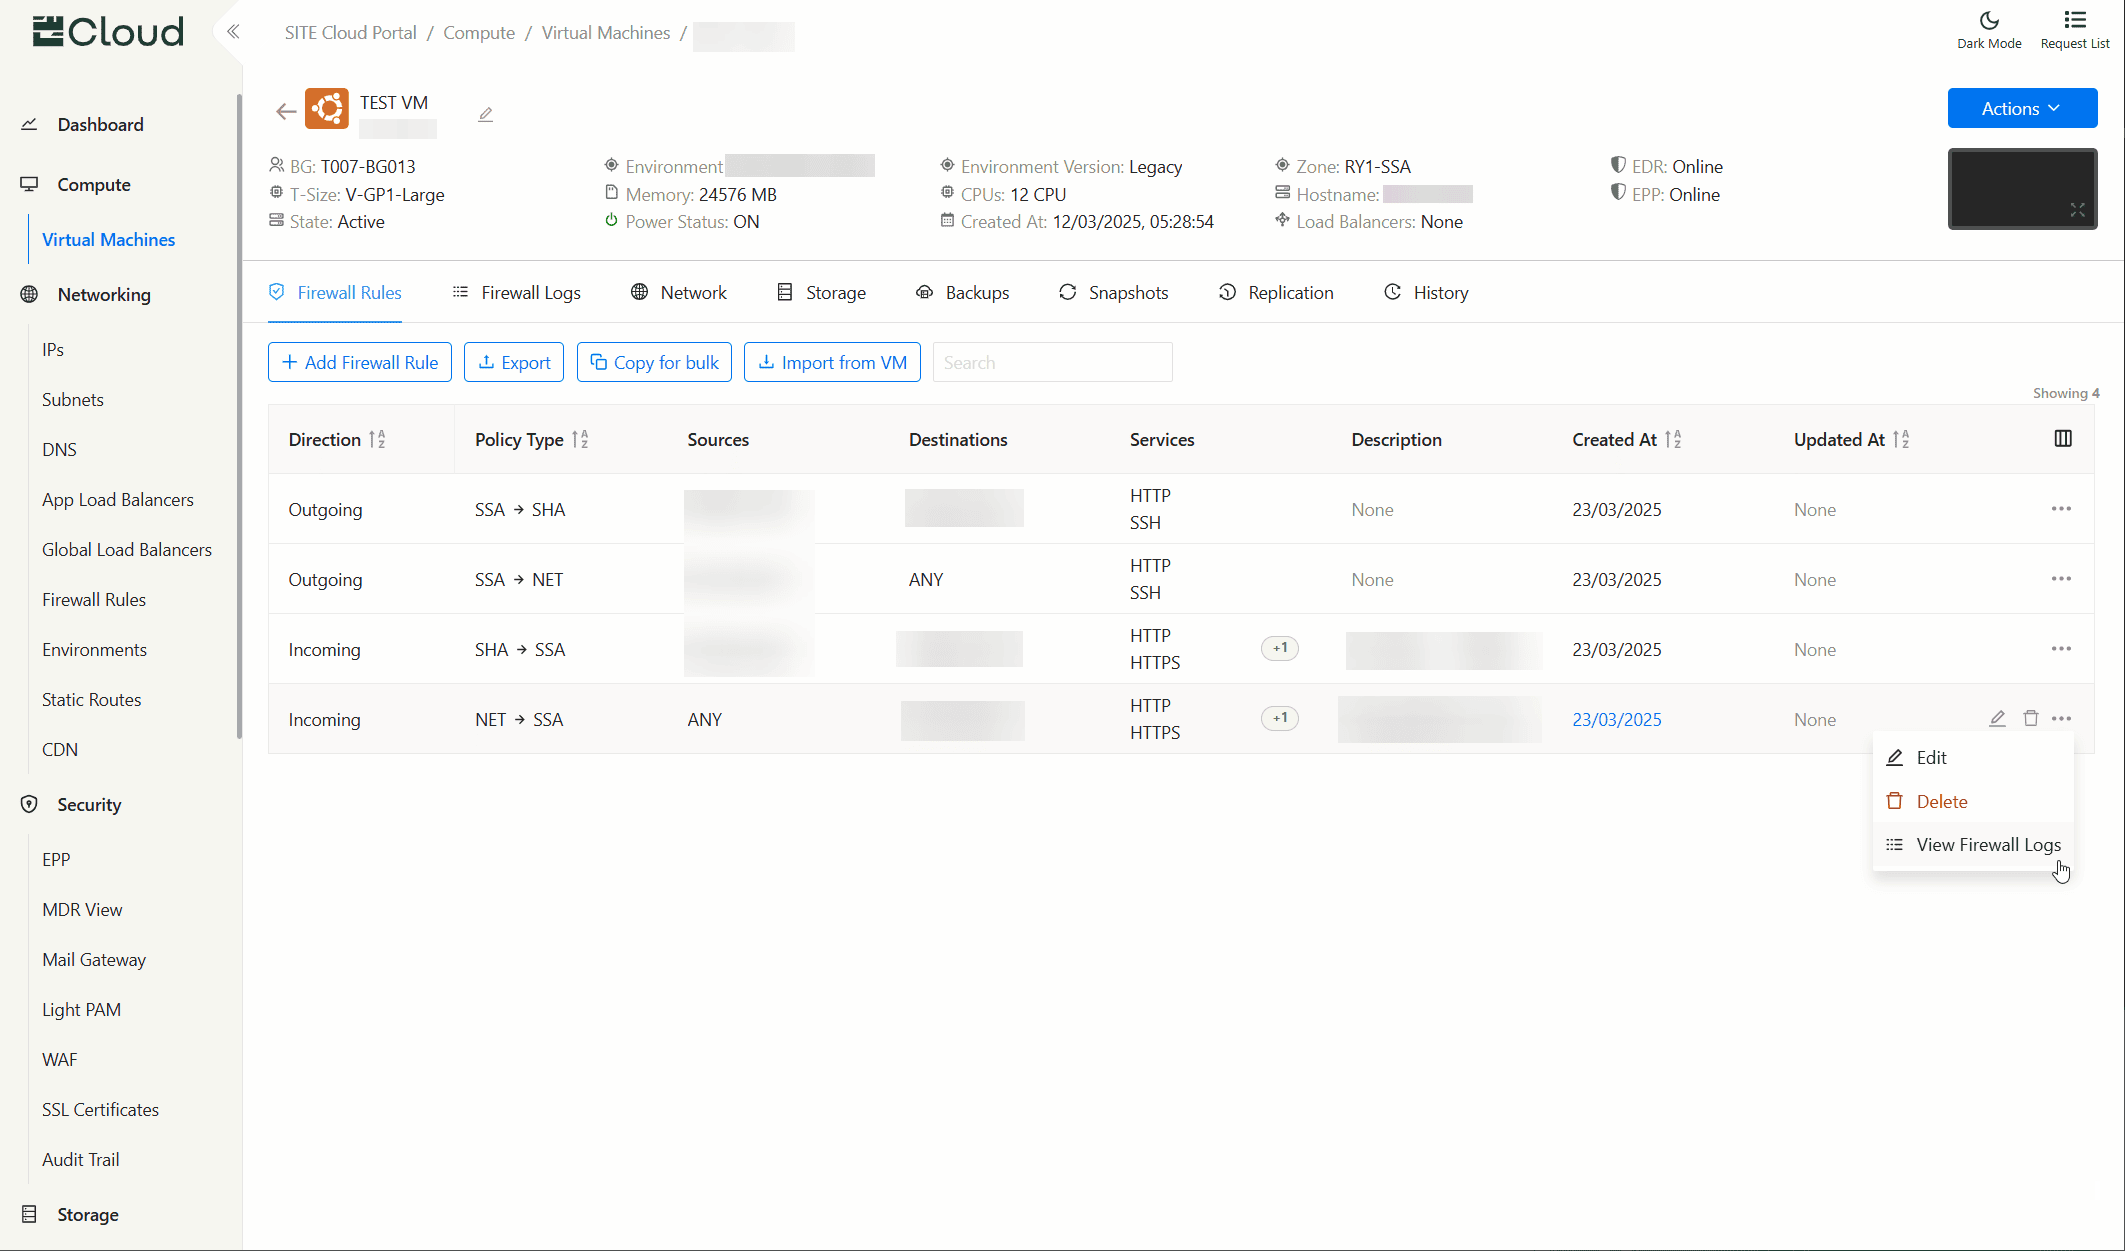
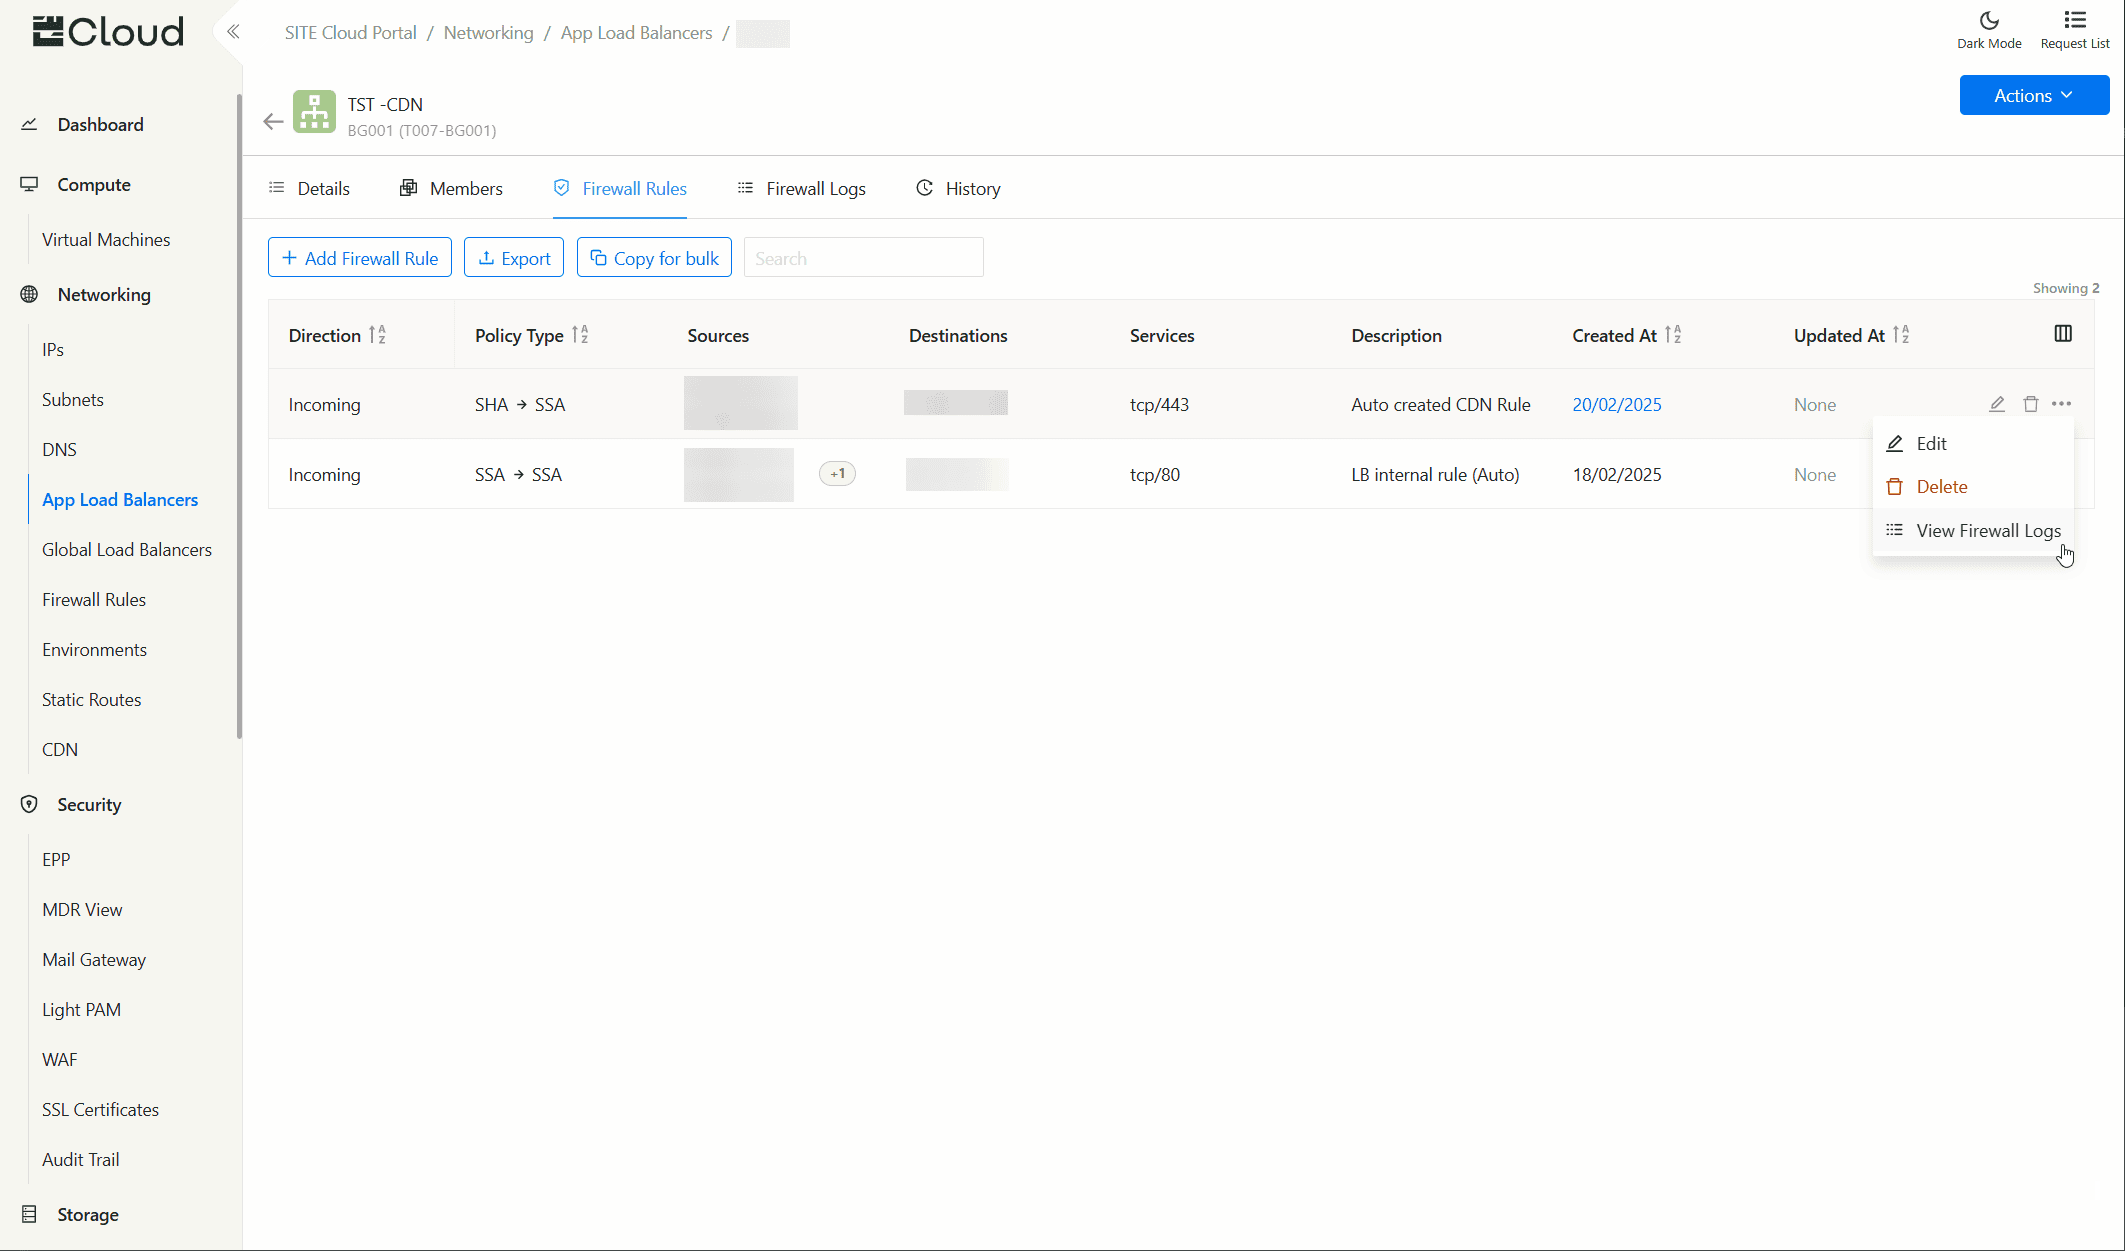
- To view a specific firewall rule's logs, click More Actions button, and then click View Traffic Logs
- Select Firewall Logs tab
- The view displays an empty space with query filters on the side to be filled.
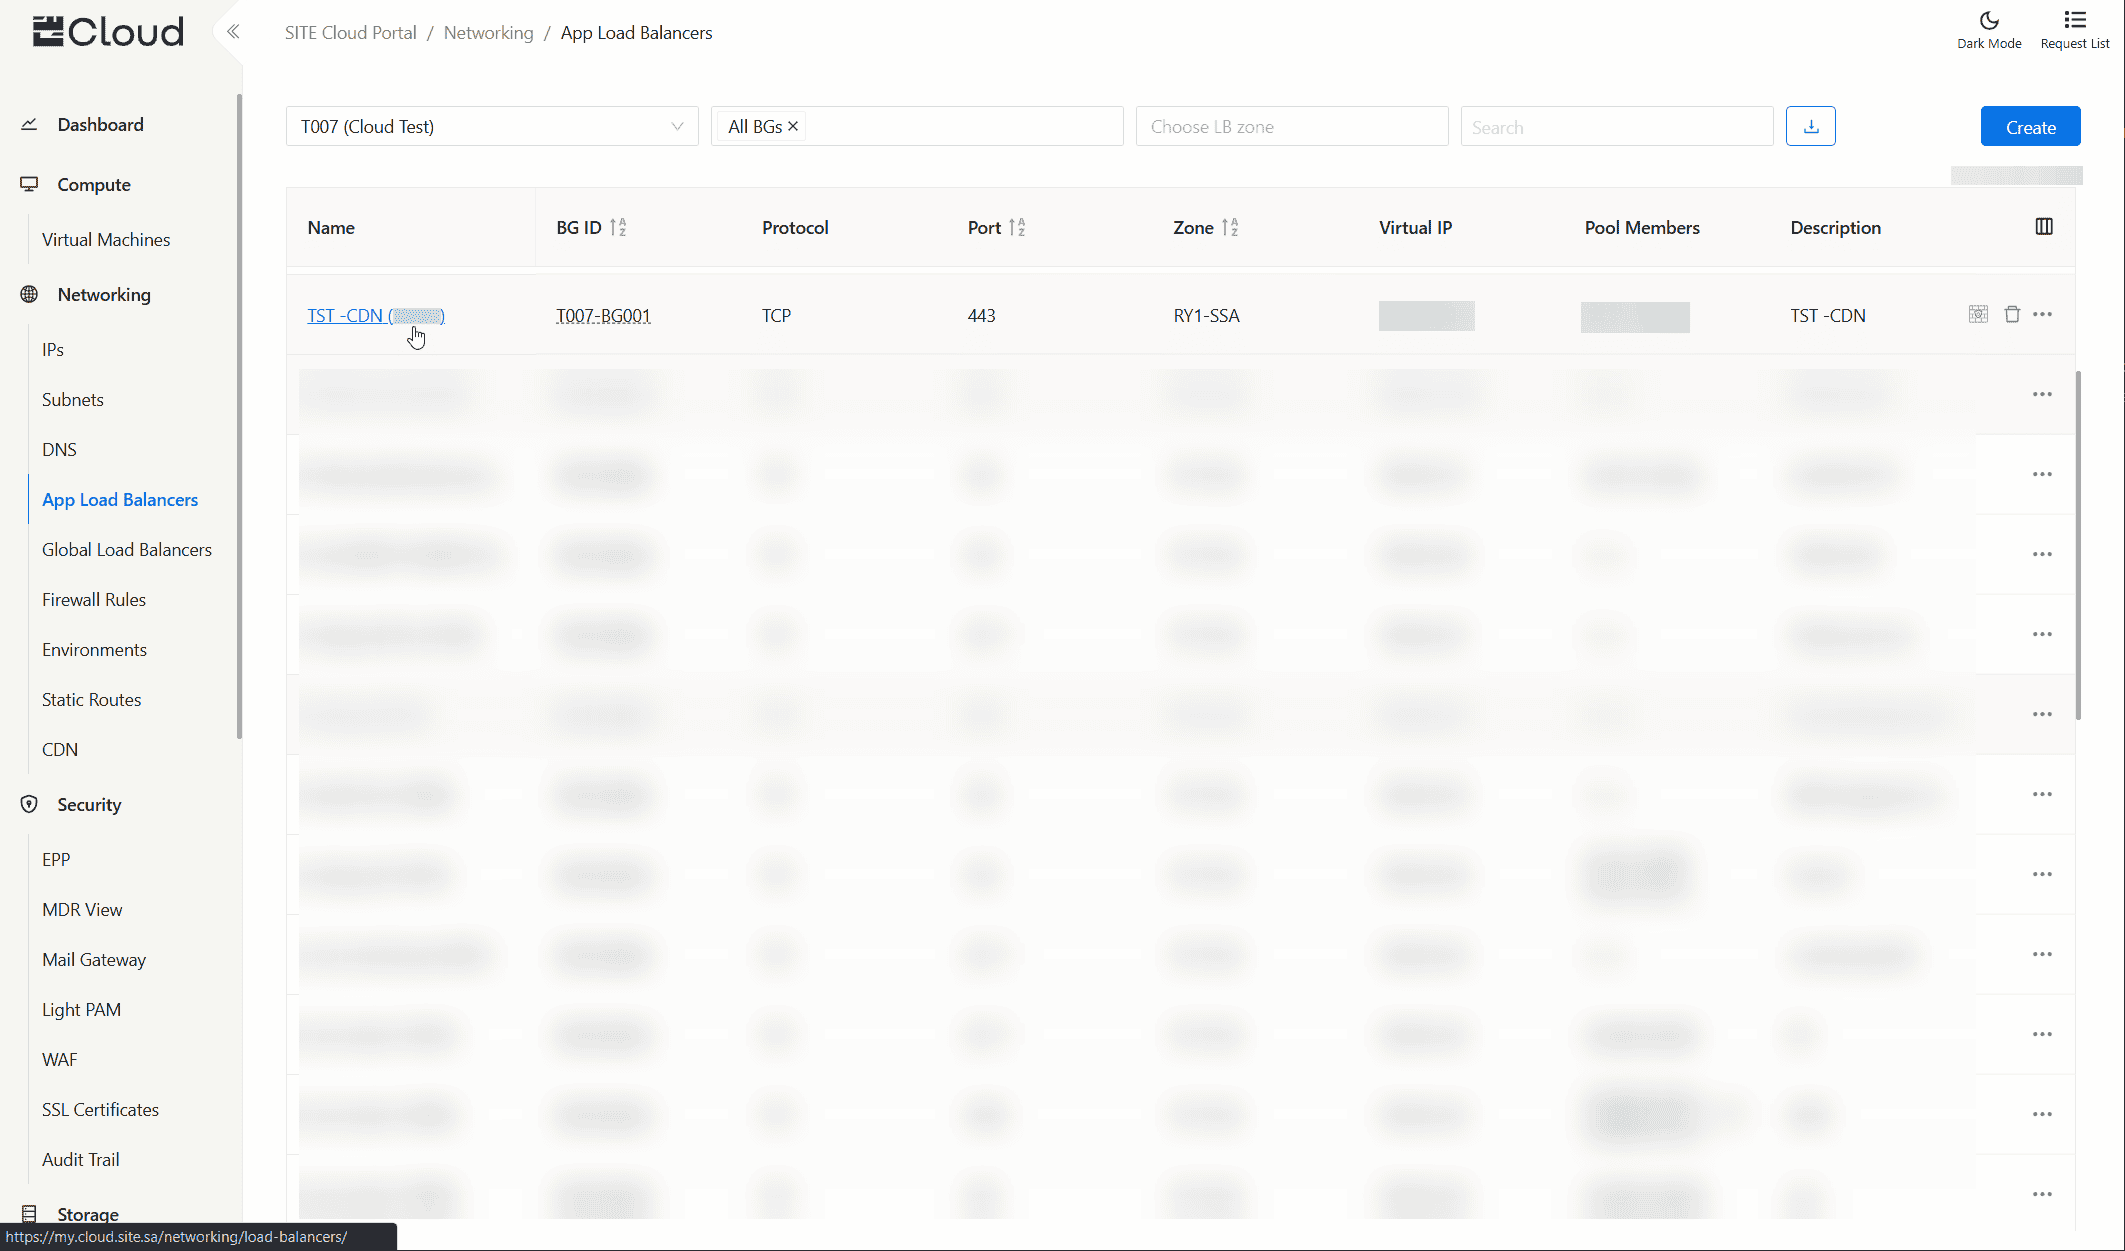
Load Balancers
- Navigate to the Load Balancers page using the side navigation menu
- Click on any load balancer to view its logs.
- To view a specific firewall rule's logs, click More Actions button, and then click View Traffic Logs
- Select Firewall Logs tab
- The view displays an empty space with query filters on the side to be filled.
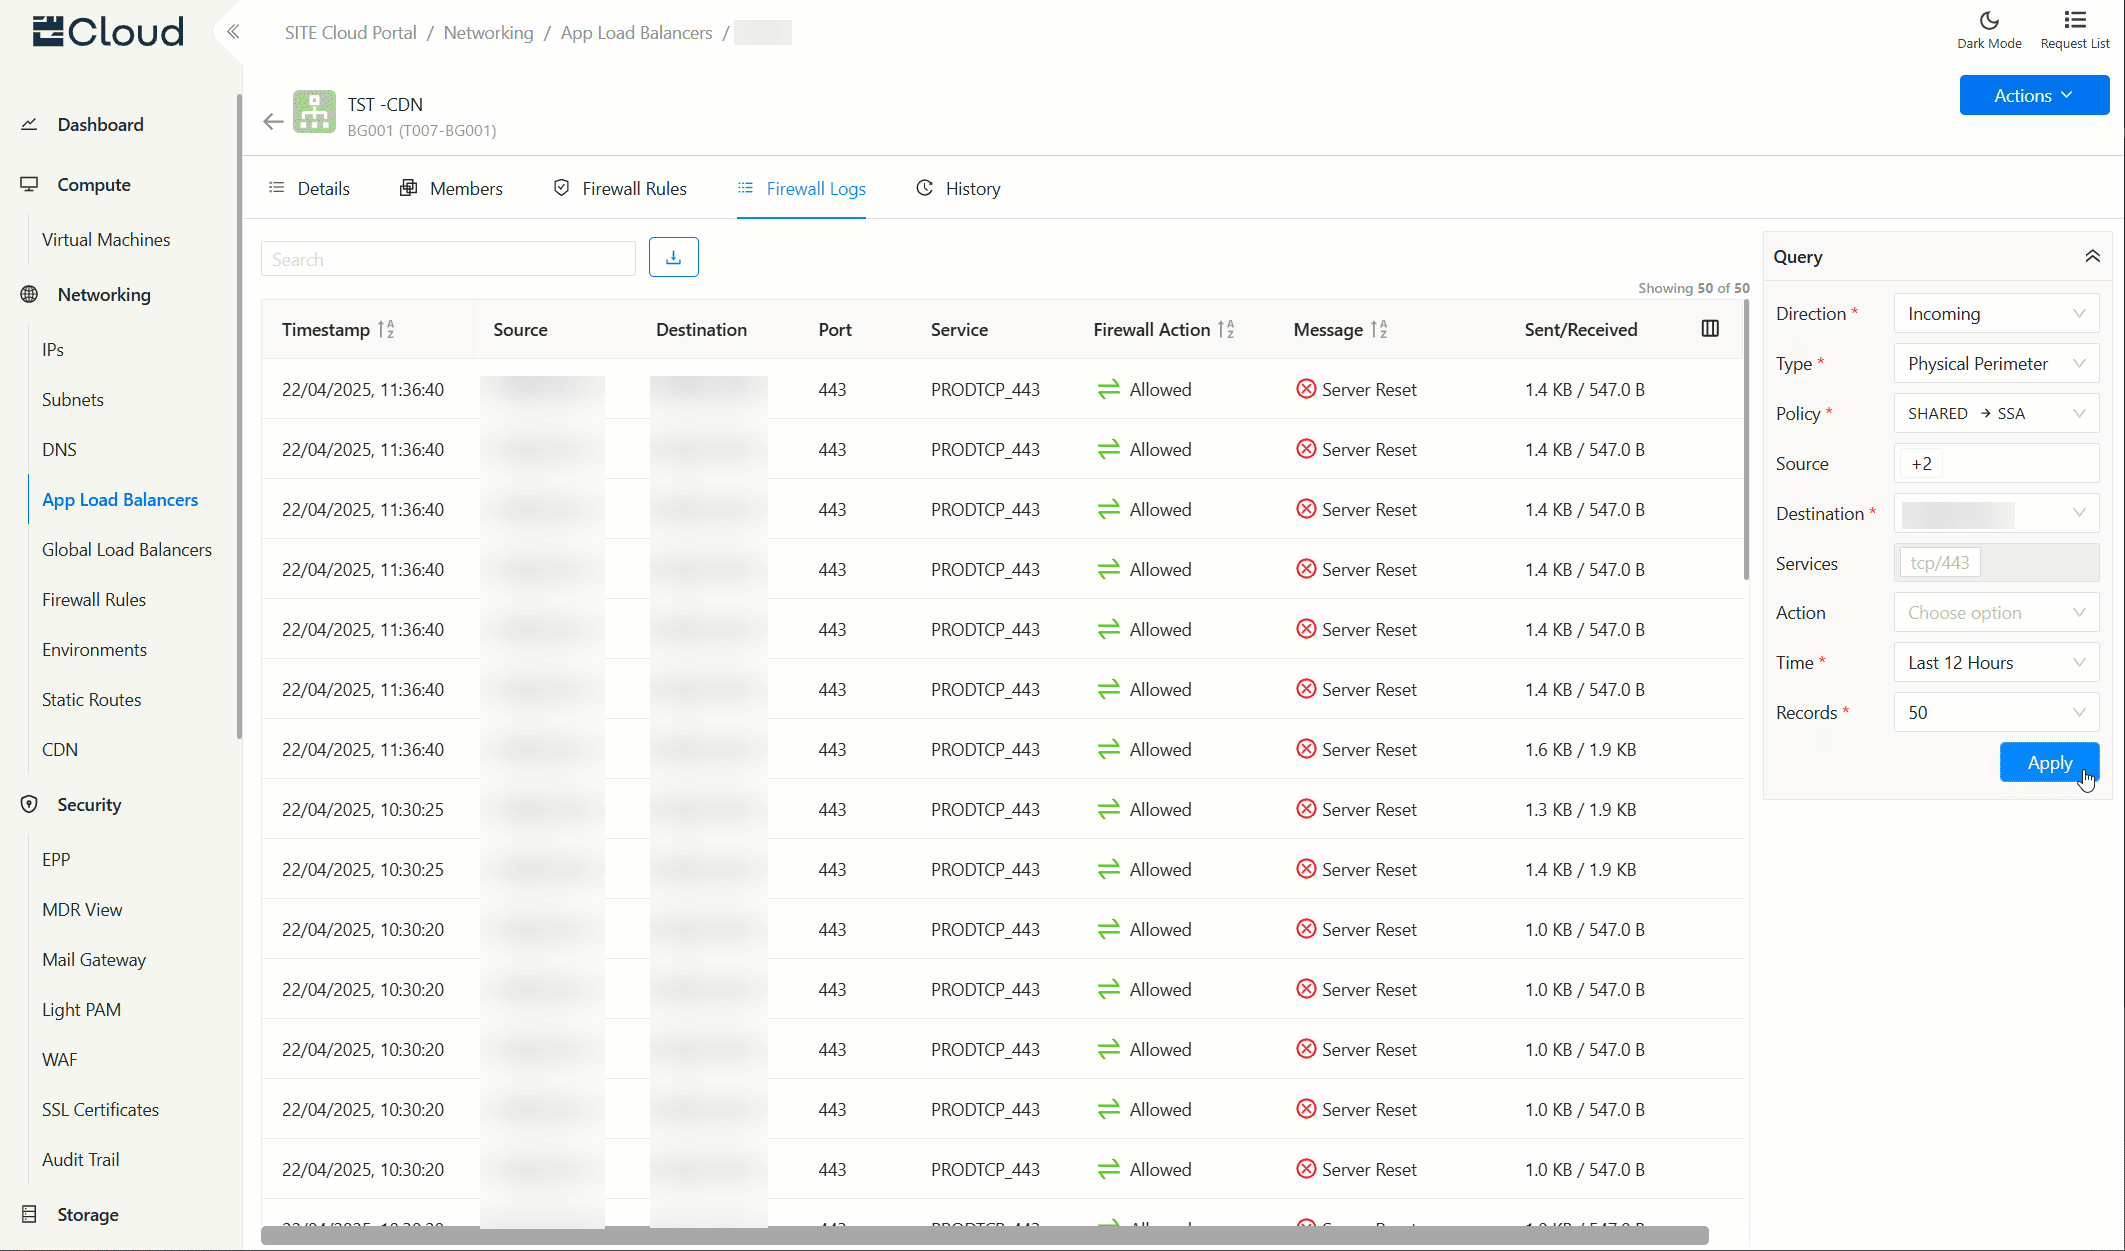
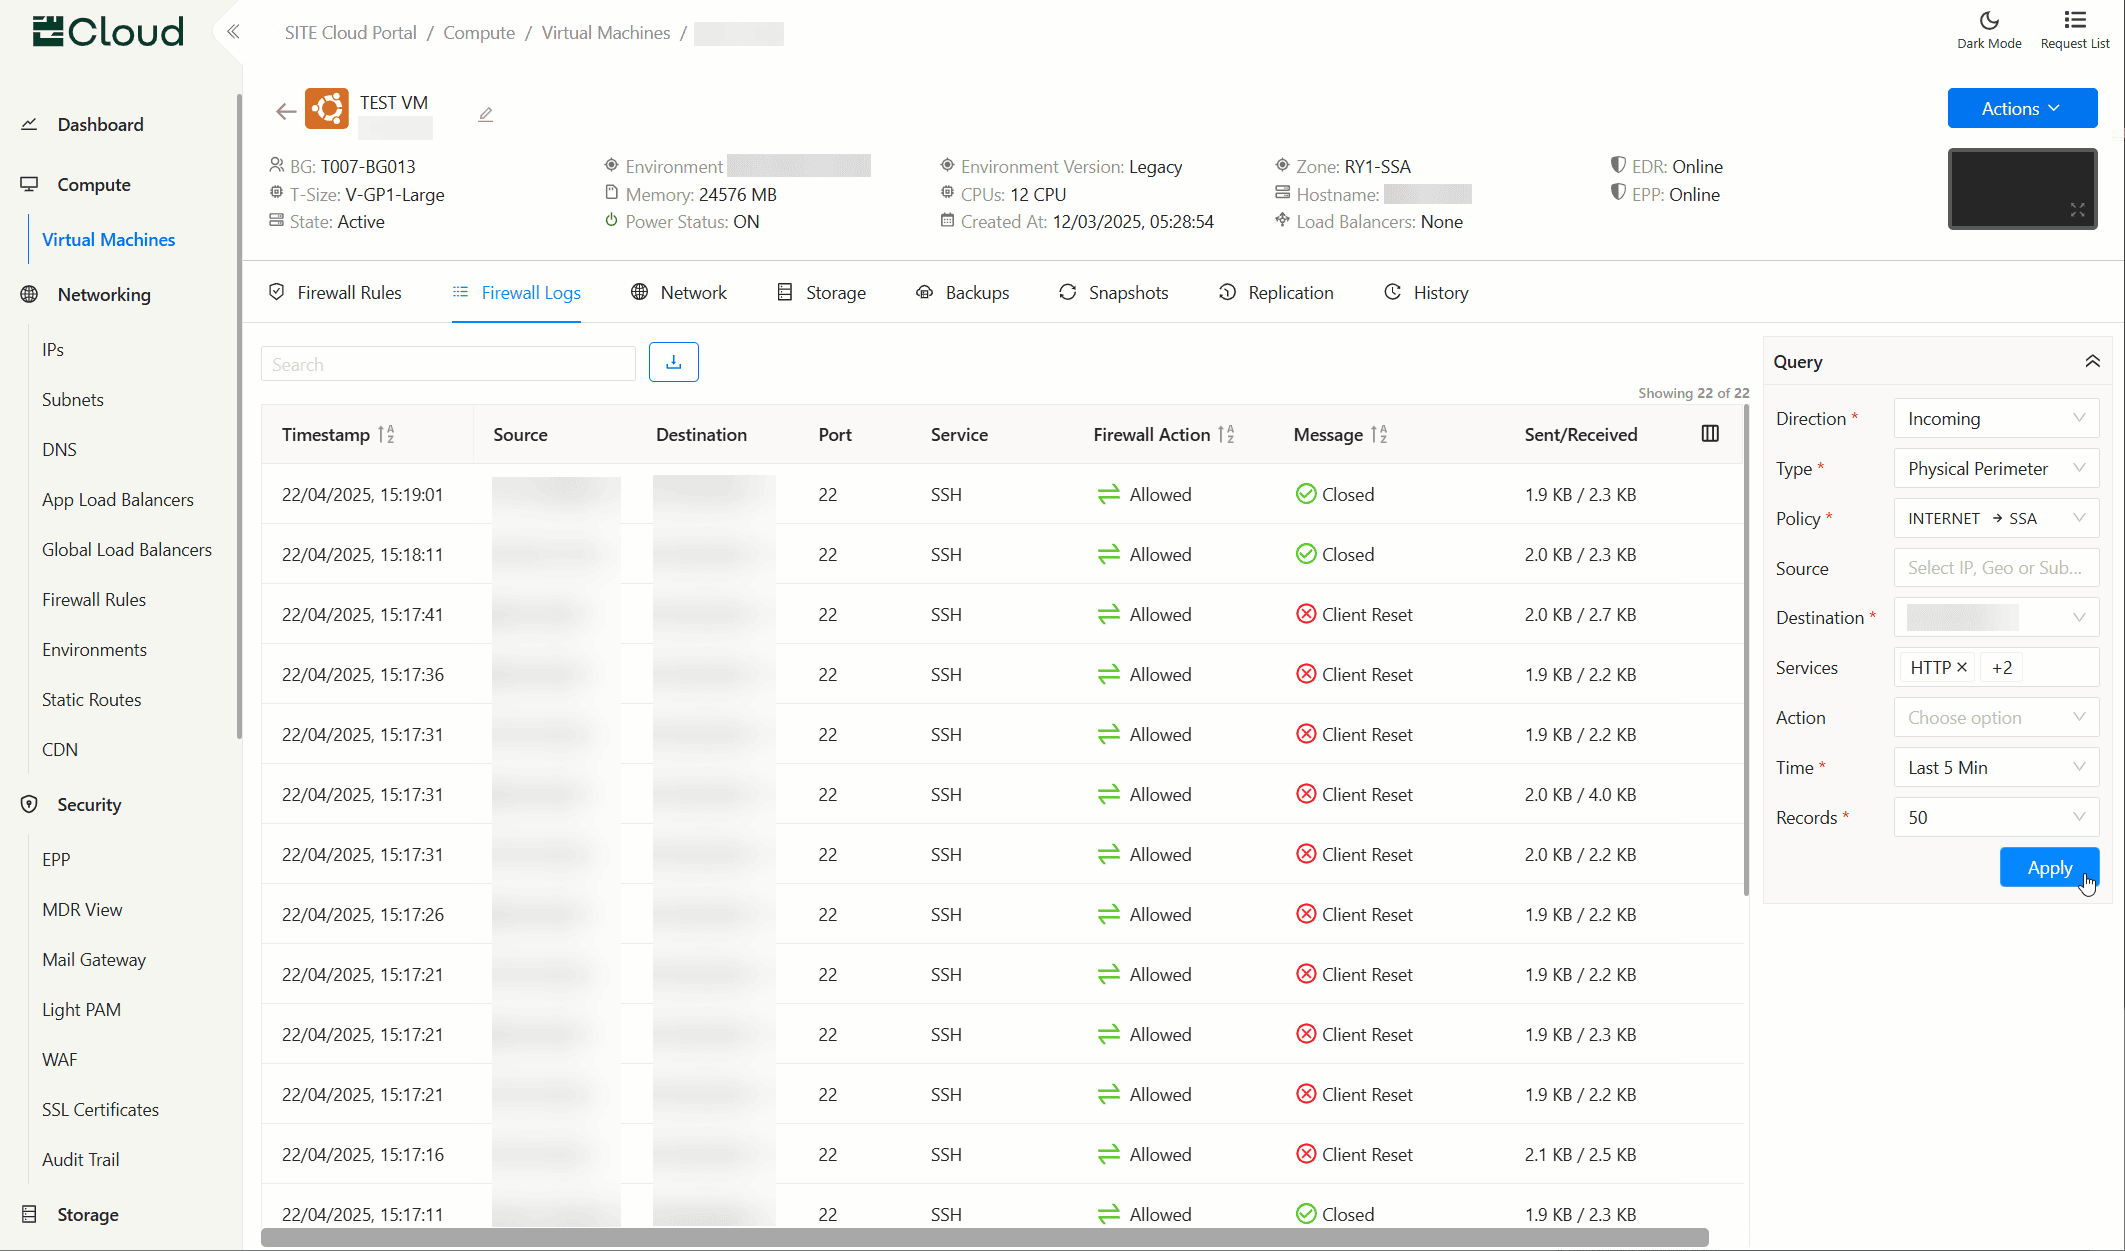
Understanding the Interface
The Firewall Logs interface consists of several key components:
- Filter Panel: Located at the right-side of the screen, used to initiate and refine visible logs
- Log Table: The main display showing individual traffic log entries
- Action Bar: Tools for exporting logs, quick searching existing logs, and configuring table columns display options
Filtering Traffic Logs
Available Filters
- Direction: Show
IncomingorOutgoingtraffic directions - Type: Filter by Physical Perimeter (North-South) or Micro-segmentation (East-West) firewalls
- Source/Destination: Filter by specific IP addresses, subnets, known entities, or any by leaving it empty (depends on the Direction selection).
- Services: Filter by a pre-defined service, a custom pair of protocol/port, or all services by leaving it empty.
- Firewall Action: Show
Allowed,Denied, or both by leaving it empty. - Time: Filter by showing logs within:
- Last 5 minutes
- Last 30 minutes
- Last hour
- Last 12 hours
- Last 24 hours
- Records: Limit the number of records shown
Filter Best Practices
- Start with a reasonable time range to limit the volume of logs
- Add additional filters incrementally to narrow down to relevant traffic
- Use the Firewall Type filter early to focus on either external or internal communications
- For micro-segmentation analysis, start with specific services or application tiers
- Combine Direction and Firewall Type filters for precise investigation workflows
Understanding Log Data
Log Table Columns
- Timestamp: When the log entry was created
- Source: Origin IP address initiating the request
- Destination: Target IP address receiving the request
- Port: Port number on the destination server
- Service: Recognized service name
- Firewall Action: Whether traffic was
AllowedorDeniedby the firewall - Message: Detailed information about the connection status, possible values:
Closed: The connection was properly terminated by either the client or server following normal network protocols.Accepted: The connection was successfully established and traffic was allowed to flow through the firewall.Client Reset: The client (source) abruptly terminated the connection by sending a TCP reset packet.Server Reset: The server (destination) abruptly terminated the connection by sending a TCP reset packet.Destination Timeout: The connection exceeded the maximum allowed time limit and was terminated by the firewall.Rejected: The firewall explicitly blocked the connection attempt based on security policies.Timeout: Communication between internal services exceeded the allowed time limit and was terminated
- Sent/Received: Data volume sent and received during the connection
Common Workflows
Investigating Denied Connections
- Set the Firewall Action to
Denied - Look for patterns in Source, Destination, or Service
- Examine the Message for specific denial reasons
- Check if the denied connections are expected based on your security policies
- For micro-segmentation denials, verify if the communication should be allowed between internal services
Monitoring External Access
- Filter by Direction,
IncomingorOutgoingas needed - Set the Firewall Type to
Physical Perimeter(North-South) - Review the source and destination entities in the logs to verify expected traffic patterns
- Examine traffic volume and bandwidth for anomalies
Analyzing Internal Service Communication
- Filter by Direction,
IncomingorOutgoingas needed - Set the Firewall Type to
Micro-segmentation(East-West) - Filter for specific services or applications of interest
- Review communication patterns between internal services
- Look for unexpected connections that might indicate:
- Configuration issues
- Unauthorized lateral movement
- Compliance violations
Related Documentation
Updated at 2025-07-29